Product Designer · Valencia, Spain
ANGELICA
Rey.
Hello, I'm a Product designer creating clear and efficient digital experiences — based in Spain. Let's create!

Open to work
Valencia · Remote
Hello, I'm a Product designer creating clear and efficient digital experiences — based in Spain. Let's create!


I create experiences that don't just look good, they perform better: less friction, fewer errors, and real impact on how people interact with products.
With a background in Business Administration, I bridge the gap between design and business. I make data-driven decisions that enhance both the user experience and the product's bottom line.
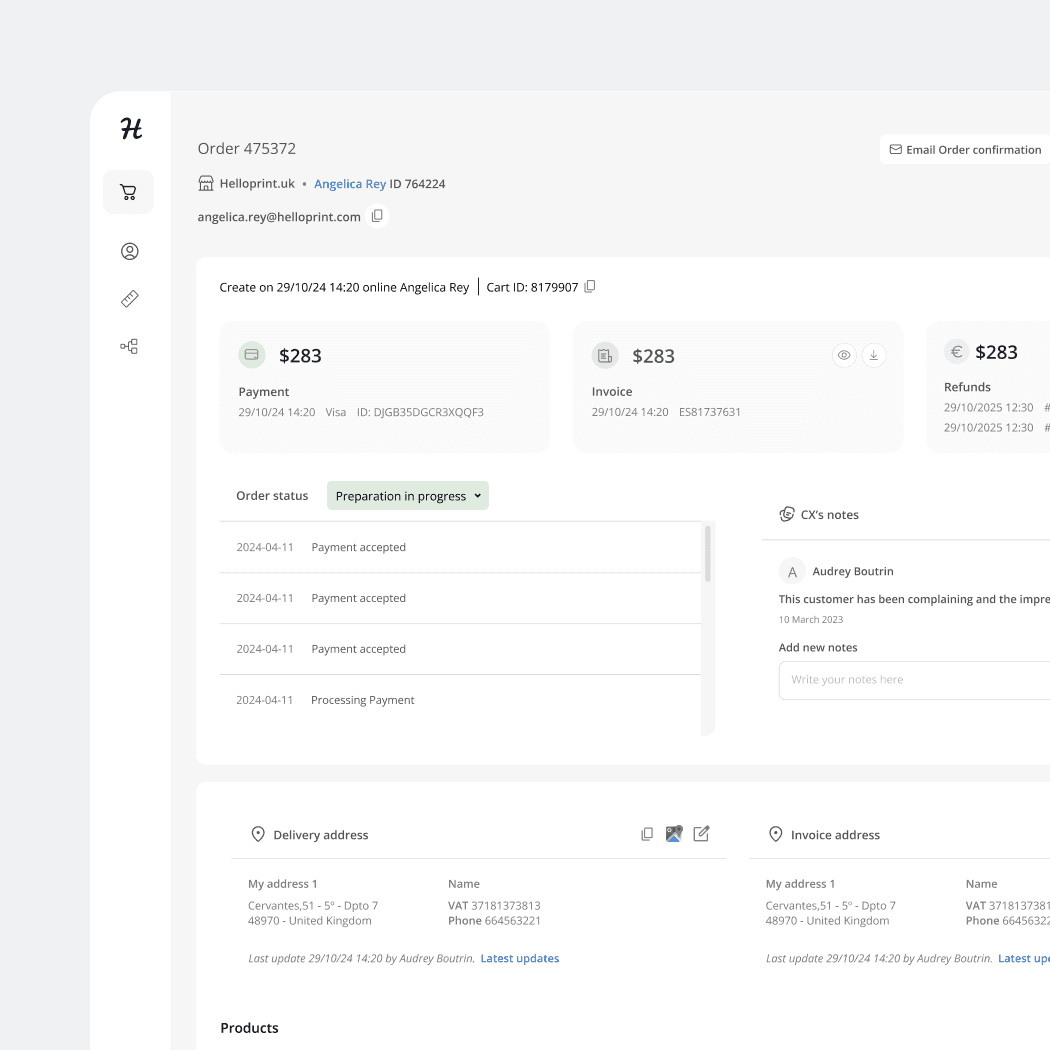
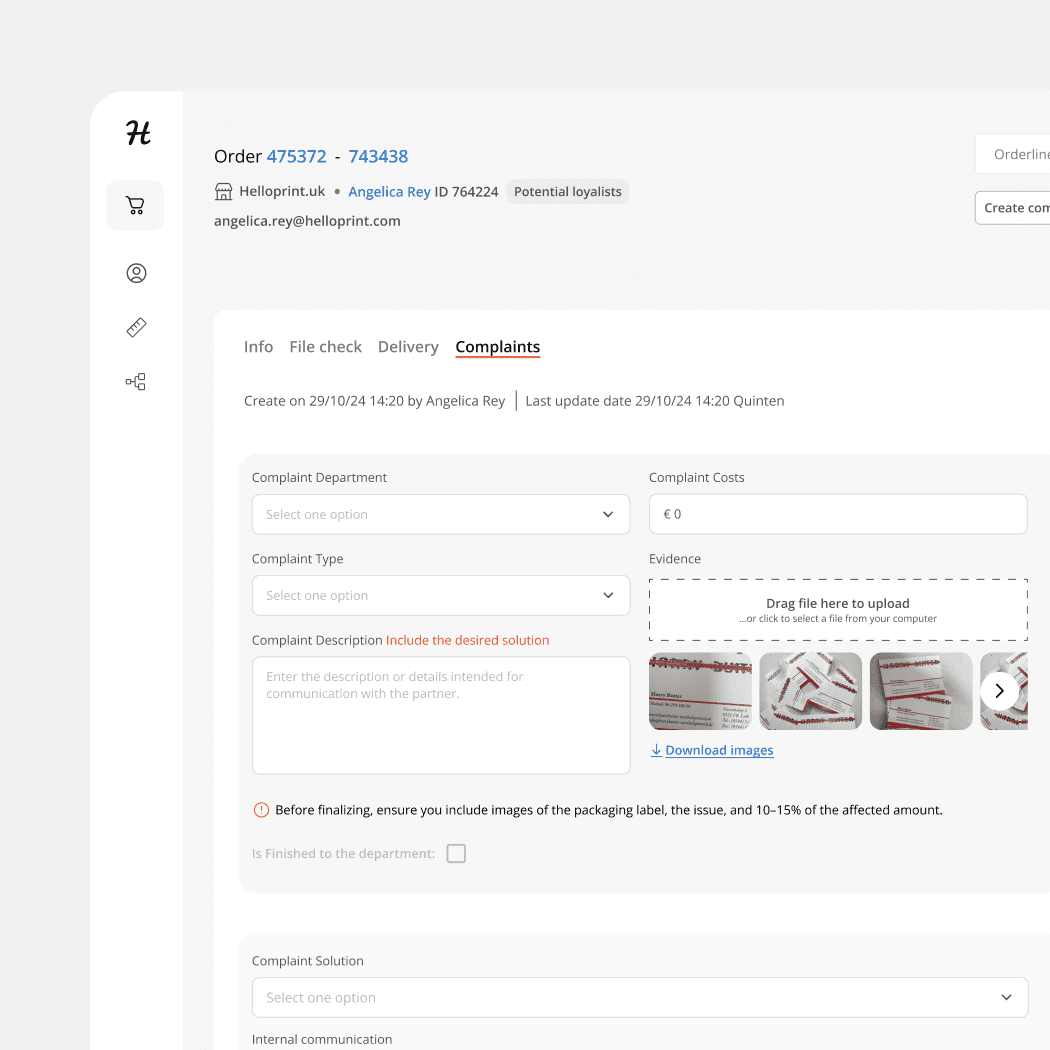
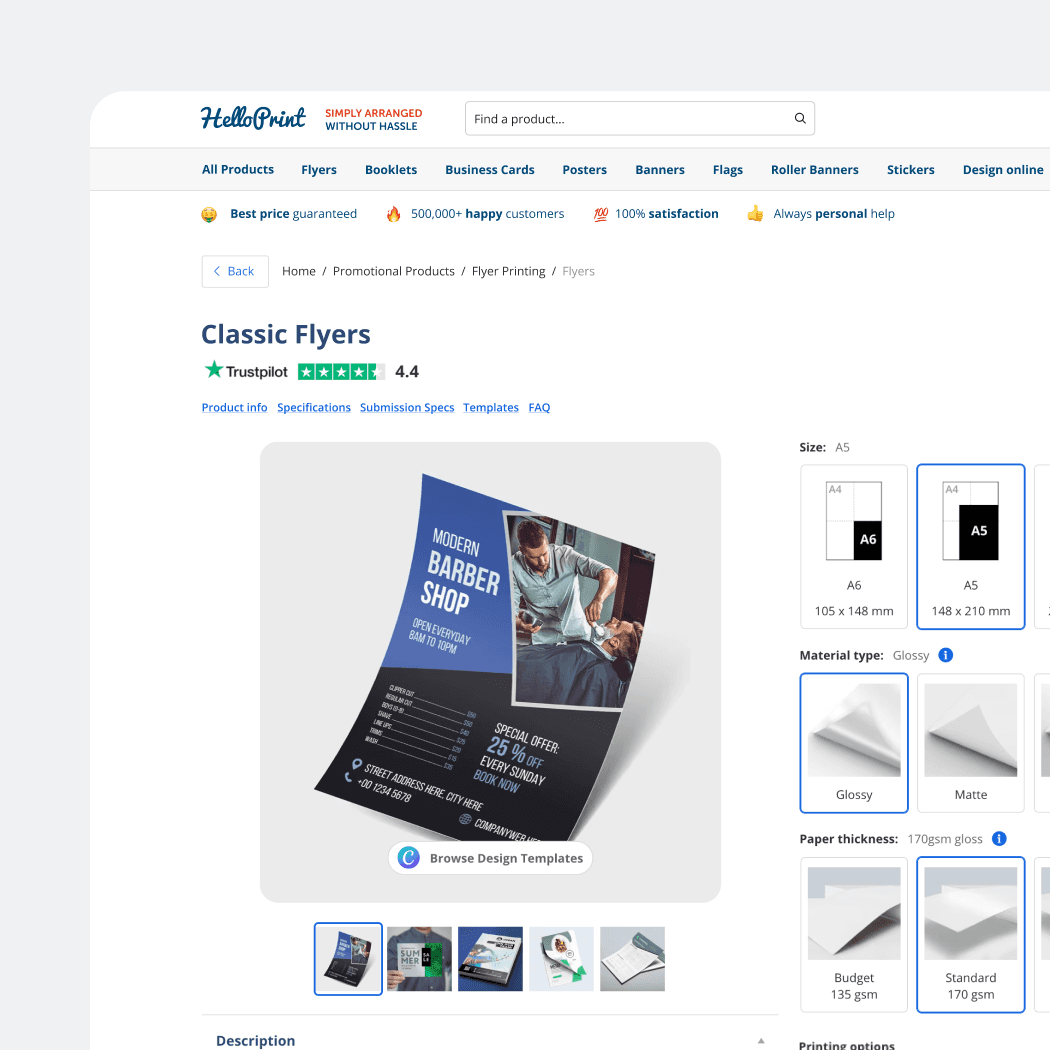
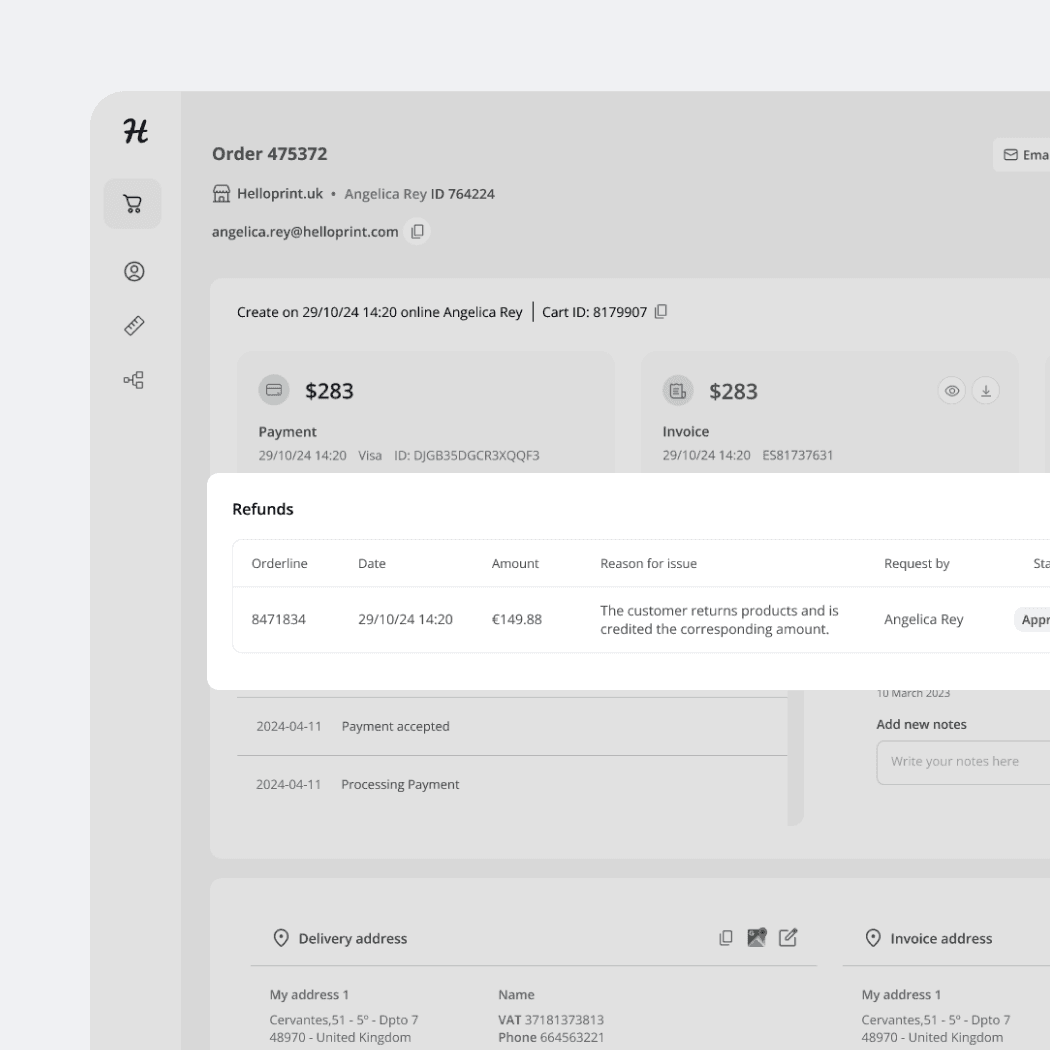
At HelloPrint I grew from UX/UI Designer into a Product Owner role — leading strategy, owning the backlog, and shipping tools used daily by 20+ people. I'm drawn to complex operational problems where good design saves real time and real effort.

Two years, two product roles, one consistent focus: making complex systems feel simple for the people who use them every day.
↓ Download CVOpen to product design roles, short-term contracts, or a good conversation about building better products.